To Issue 146
Citation: Sardo G, “Rethinking Plastic: How Eco-Friendly Design is Driving Sustainable Change.” ONdrugDelivery, Issue 146 (Apr/May 2023), pp 32–36.
Giorgio Sardo discusses sustainable material selection and the results of tests comparing the performance of sustainable bio-based plastic resins with their fossil-based equivalents.
“Not all plastics are the same, nor do they generate the same CO2e emissions.”
In 2015, the United Nations unveiled its Sustainable Development Goals (SDG) – a blueprint for a more sustainable future. These goals have informed the sustainability strategies of public and private organisations of all sizes around the world, including medical equipment manufacturers.
One of the goals specifically aspires to ensure sustainable consumption and production patterns and serves as a guiding principle for manufacturers keen to reduce demand on natural resources.
A ROLE FOR PRODUCT DESIGNERS
Product designers rely on the disciplines of design for assembly or design for manufacturing to improve aspects of a product. But reducing the environmental impact over the entire product lifecycle requires a focus on design for environment (DFE). These guidelines offer product designers numerous options to improve the sustainability of their product, including increased durability, better energy efficiency, and easier disassembly and reassembly to enable maintenance, repair, refurbishment or recycling.
DFE guidelines can also support the selection of raw materials with lower greenhouse gas emissions as measured in CO2 equivalent (CO2e). This metric can be used to standardise the measurement of climate effects of various greenhouse gases.
REDEFINING PLASTIC
Plastic is the chameleon of modern materials. Its versatility, resiliency and durability have made it an indispensable material for an incredible range of applications, from automotive and agriculture to construction, containers, textiles and toys. It is also widely used in healthcare, for both disposable and durable products.
Plastic has an important role to play in ensuring sustainable production. However, not all plastics are the same, nor do they generate the same CO2e emissions. For example, acrylonitrile butadiene styrene (ABS) plastic creates about half the CO2e emissions of polycarbonate (PC).
ABS has a similar tensile modulus and a smaller tensile strength but high impact, heat, chemical and abrasion resistance. ABS also has a higher natural ultraviolet (UV) resistance and rigidity compared with polycarbonate. This means there are cases where PC can be replaced by a PC/ABS blend – or even pure ABS – to give a significant reduction in resin emissions.
Table 1 lists some commonly used resins with their respective CO2e emissions, and the energy and water consumption needed to produce 1 kg of raw material.
| Material | Description | CO2e (kg) |
Energy (MJ) |
Water (m3) |
| ABS | Acrylonitrile-butadiene-styrene | 4.7 | 120.7 | 0.014 |
| PC/ABS | 70/30 PC ABS | 6.9 | 129.2 | 0.018 |
| PET | Polyethylene terephthalate | 4.0 | 102.6 | 0.021 |
| PMMA | Polymethyl methacrylate | 7.6 | 154.0 | 0.014 |
| Polycarbonate | Polycarbonate | 7.9 | 132.9 | 0.019 |
| Polypropylene | Polypropylene | 7.9 | 132.9 | 0.019 |
| Polyurethane | Polyurethane | 2.0 | 81.7 | 0.006 |
| POM | Polyoxymethylene (acetal) | 3.1 | 63.8 | 0.011 |
Table 1: Sourced from Ecoinvent v3.9. data.
MAKING A MATERIAL DIFFERENCE
When it comes to material selection, there are several design guidelines that can influence the CO2e number. The most straightforward of these is to reduce the amount of material used. To illustrate the point, it is now common for beverages to be packaged in plastic bottles with thinner walls and less material.
When it comes to choosing lower-emission materials, manufacturers have a choice of, but are not limited to:
- A traditional (fossil-based) resin but with lower emissions, as described in the ABS/PC example
- A fully or partially recycled material
- A material made from bio/vegetal feedstock and based on a mass balance approach.
“Using recycled, rather than virgin, materials raises the bar and offers an immediate CO2 saving.”
FULLY OR PARTIALLY RECYCLED MATERIALS
Using recycled, rather than virgin, materials raises the bar and offers an immediate CO2 saving, as between 30% and 70% of the total material weight can be replaced with post-consumer or post-industrial recycled waste. This has a double benefit of both diverting waste from landfill and producing fewer emissions – i.e. less energy is required to process (recover, sort and clean) the waste material and turn it into a new resource than would be needed to create it.
Polystyrene used in food packaging is a good example. Once the waste material is collected, an infrared detector is used to identify and separate resins. The polystyrene is then shredded and cleaned to remove foreign materials like food, labels and metallic parts. It is then ready for a new production cycle, but with 50% less CO2 emissions. Its overall characteristics and material purity make recycled polystyrene acceptable for food contact. However, for a medical product, where biocompatibility standards are more sophisticated, we must raise the bar once more.
BIO-BASED MATERIAL
Bio-based material offers an opportunity to create a sustainable material suitable for use in a healthcare environment that is substantially identical to its fossil-based equivalent but made from a biological source and following the mass balance approach.
“Bio-based material offers an opportunity to create a sustainable material suitable for use in a healthcare environment that is substantially identical to its fossil-based equivalent.”
When we consider the CO2e emissions based on a cradle-to-gate lifecycle assessment, which calculates emissions from resource extraction (cradle) to the factory gate, we can validate CO2e reductions that in some cases – such as a bio-based polycarbonate – lead to a climate neutral material. Additionally, traditional fossil-based material can be directly substituted with biomaterials without changing the parts production process and thus without the need for revalidation activity.
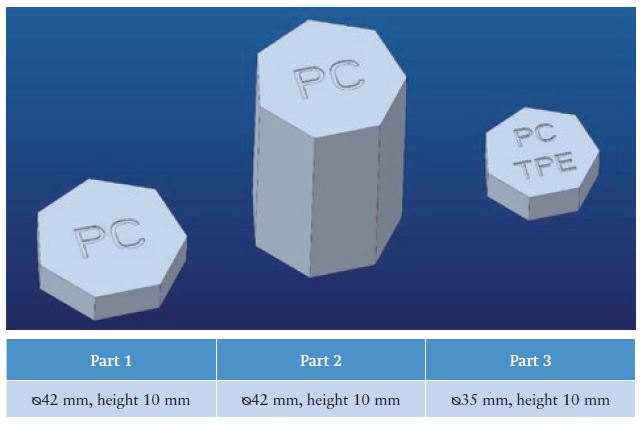
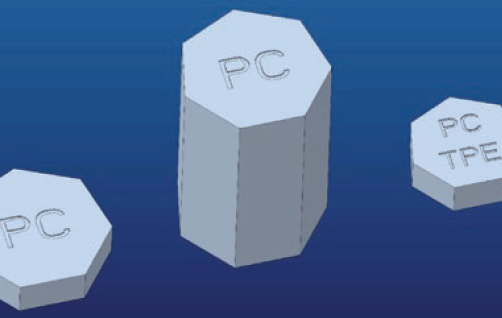
Figure 1: Material and dimensions of the parts under test.
TESTING THEORY
To prove that biomaterials can offer a drop-in solution, directly replacing existing materials, the Flex team at the Milan Design Center (Italy) performed a comparative evaluation between standard resin (PC) commonly used in durable devices and a climate-neutral biocompatible grade of this material that we’ll call the “green” version.
The test was carried out on a subassembly comprising three components designed in transparent PC: two of them made from standalone PC, while the third was two-shot injection moulded (2 k shot) PC plus thermoplastic elastomer (TPE). The three parts had the shape of heptagonal prisms, whose dimensions are shown in Figure 1. Two groups of tests were carried out to examine the equivalence of the injection moulding process and the mechanical resistance.
MOULDING TEST
To evaluate the mouldability characteristics, 100 kits in the standard material and 100 kits in the “green” material were produced in the same day, according to the following rules:
- Both materials were handled and prepared under the same conditions
- Both materials were moulded with the same process parameters and the same equipment
- For each material, the outputs reported into the process parameters sheet were recorded.
The tooling team used three criteria to evaluate the mouldability properties of the two materials:
- The injection parameters
- The dimensional report
- The aesthetic appearance of the parts.
The result of the comparison is summarised in Table 2.
| Evaluated Item | Standard Resin verses “Green” Resin |
| Test Results | |
| Injection parameters | Negligible pressure difference at injection peak and switchover |
| Measurement report (FAI) | No relevant change or minor differences (less than 0.05 mm) |
| Visual inspection | No relevant difference. In one of the three parts the same weld lines are visible (see figure 2) |
| Conclusion | The two material grades analysed can be considered equivalent based on the three tested parts |
Table 2: Summary table of the mouldability evaluation.
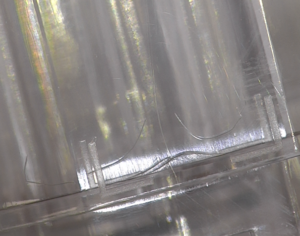
Figure 2: Weld lines.
No appreciable difference was found between the two materials – even aesthetic defects, such as the weld lines shown in Figure 2, were identical.
MECHANICAL RESISTANCE TEST
The mechanical resistance evaluation was carried out using three tests, listed below, and taken from IEC 60601-1-11:2015 + AMD1:2020 (requirements for medical electrical equipment and medical electrical systems used in the home healthcare environment):
- Drop (clause 15.3.4.1)
- Push (clause 15.3.2)
- Impact (clause 15.3.3).
This evaluation was used to perform a thorough mechanical test campaign of the subassembly comprising the three parts produced with the two PC versions. These tests are applicable to wearable devices.
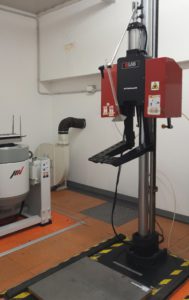
Figure 3: Drop machine.
DROP TEST
In the drop test, the samples were allowed to fall freely once from three different starting positions onto a 50 mm thick hardwood board lying on a rigid concrete base. The drop height was progressively increased from 1 m until failure, to identify the material equivalence. The test was carried out in Flex laboratories using the drop machine shown in Figure 3.
Table 3 shows the test results summary. Each column represents a drop, beginning from 1 m in height and going up to 2.1 m. The yellow cells identify “test observations” – e.g. a partial part detachment – while red cells identify a part breakage. Looking at the colour distribution, the two groups behave in an equivalent way. Using a statistical T test to compare the cumulative means of the drop height further confirmed the equivalence.
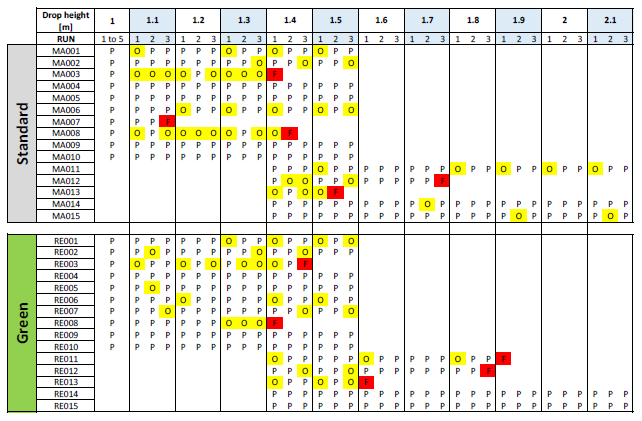
Table 3: Drop test summary table.
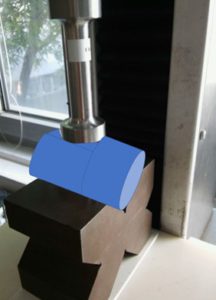
Figure 4: Push test set-up.
PUSH TEST
In the push test, the devices were subjected to a steady force for five seconds that was applied using a flat tool, as shown in Figure 4. The tested subassembly is depicted as a blue cylinder.
The subassemblies were stressed by applying and increasing the load along the orientations shown in Figure 5, up to and including the point of failure. The tests were performed in a Flex laboratory using a tensile tester.
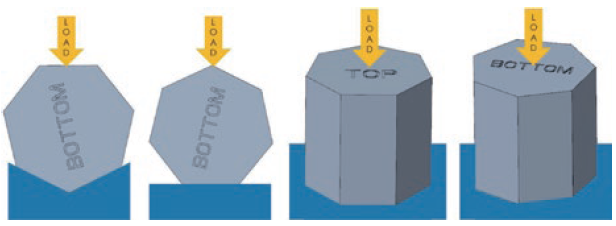
Figure 5: Push test – load orientations.
The equivalence of the two materials is visible in Figure 6, which shows the tensile tester output (load [N] versus displacement [mm]). The brown line represents the standard material, while the green line corresponds to the “green” material. The two curves almost overlap, thus the elastoplastic behaviour of each assembly, using two different materials, is practically identical.
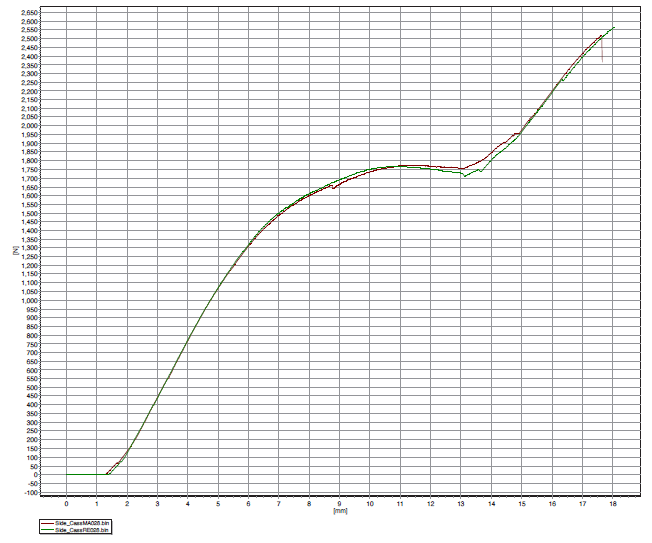
Figure 6: Push test – tensile tester graph (N versus mm).
IMPACT TEST
The impact test was carried out in a Flex laboratory using a 250 g metal bullet falling freely from an increasing height, up to and including the point of failure. The same point used for the push test shown in Figure 6 was used in the impact test. The test results are summarised in Figure 7, where each coloured bar represents one impact, with its length proportional to the energy. The red bars correspond to failures (cracks) and show comparable results for both materials at the same energy level, confirming equivalence in this test.
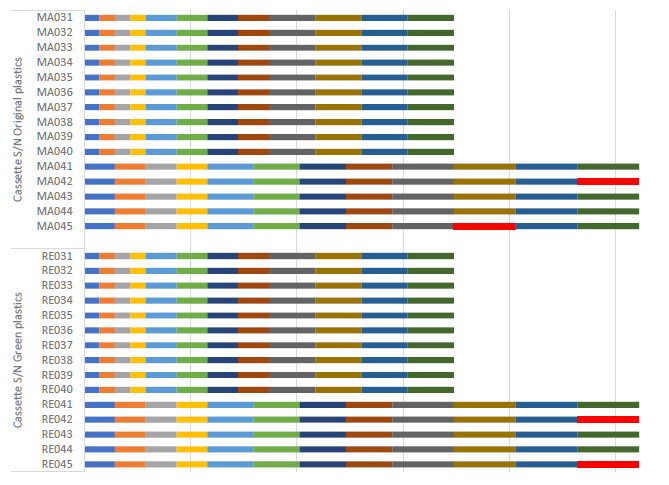
Figure 7: Impact test results summary.
CONCLUSION
Sustainability-focused companies are incorporating a lower CO2 footprint into the materials used in their medical product designs.
When it comes to plastic resins, Flex’s tests have shown that bio-based options are a valid substitute for the fossil equivalent. This green material can be used with the same tools and moulding parameters as the fossil-based version, so no additional tooling, validation expenses or effort are needed.
CO2e emissions reduction can be evaluated in a comparative lifecycle assessment performed for both new and existing products.