
Citation: Pereira J, Borda D’Água R, Copley M, Sipitanou A, “Semi-Automation in Inhaler Testing – Exploring the Potential & Practicalities”. ONdrugDelivery, Issue 114 (Nov 2020), pp 53–57.
João Pereira, Raquel Borda D’Água, Mark Copley and Anna Sipitanou, discuss the semi-automation of cascade impactor testing and the benefits it can bring in terms of quality of orally inhaled product test data, and reductions in cost and effort associated with routine, critical measurements.
INTRODUCTION
The automation of discrete steps of cascade impactor analysis offers opportunities to address variability in inhaler testing, while simultaneously reducing health and safety concerns and improving analyst productivity. The ability of cascade impaction to generate drug-specific aerodynamic particle size distribution data (APSD) for orally inhaled products (OIPs) is central to its utility, but necessitates systematic drug recovery from each stage of the impactor, and from the surfaces of other accessory components that complete the test set-up. This laborious task accounts for much of the manual effort associated with cascade impaction measurements and is a primary focus for automation. The rewards can be significant; however, such changes raise questions of equivalence to manual methods, which must be robustly answered prior to the adoption of automated methodologies.
“A back-to-back comparative study of manual and automated drug recovery carried out by Hovione … demonstrates statistical equivalence between the methods and highlights a reduction in analyst bench time of about 40%.”
In this article, we consider the semi-automation of cascade impactor testing focusing on those tasks, notably aspects of drug recovery that are easily tackled using off-the-shelf solutions. A back-to-back comparative study of manual and automated drug recovery carried out by Hovione, a leading contract development and manufacturing organisation, demonstrates statistical equivalence between the methods and highlights a reduction in analyst bench time of about 40%.
THE CASCADE IMPACTION WORKFLOW
A cascade impactor is a precision instrument that fractionates a sample on the basis of particle inertia, which is a function of particle size and velocity. The workflow associated with producing drug-specific aerodynamic particle size distribution (APSD) data for an OIP can therefore be split into two discrete elements: size fractionation of the dose (by the impactor) followed by drug recovery and quantitation, to determine the drug deposition profile.
The cascade impactor test set-up for any specific application is defined with reference to the device under test and the purpose of analysis, for example, whether the aim is to generate more clinically realistic data for research and product development, or to confirm batch-to-batch consistency for product release. A detailed discussion of cascade impactor test set-up and the issues associated with method development lies beyond the scope of this article, but is well covered by Bonam et al (2008).1
Once a test set-up has been established, routine analysis is initiated by actuating the device to release a dose into the impactor. A vacuum pump draws the sample-laden air through the stages of the impactor at a constant, defined volumetric flow rate, causing the deposition of particles above a certain cut-off diameter on the collection surface of each stage; each subsequent stage captures progressively smaller particles. Multiple actuations are frequently required to ensure a quantifiable amount of drug on each collection surface and to guarantee method repeatability.
At the end of this first part of the analysis, multiple doses of the drug product are distributed, depending on the exact test set-up, across: the mouthpiece adaptor (MA), the induction port (IP) – the interface between the device and the impactor – the pre-separator (PS) when used, each stage of the impactor, and the micro-orifice collector (MOC) or final filter.
“The product-specific nature of cascade impactor test set-ups and the complexity of the measurement process directly influence the feasibility of end-to-end automation, which is rarely, if ever, cost effective. Conversely, automating specific steps with off-the-shelf solutions can be highly beneficial.”
Completion of the analysis involves the rigorous recovery of samples from each of these surfaces. This involves wetting and rinsing each surface to dissolve the deposited sample with a suitable solvent and produce solutions of an adequate concentration for assay, typically via liquid chromatography (LC). The resulting data are converted into APSD metrics specifically for the API, typically using dedicated software.
The product-specific nature of cascade impactor test set-ups and the complexity of the measurement process directly influence the feasibility of end-to-end automation, which is rarely, if ever, cost effective. Conversely, automating specific steps with off-the-shelf solutions can be highly beneficial. The cost of such solutions is far more accessible than a bespoke automation project and they can deliver significant improvements in day-to-day practice, reducing analyst fatigue and stress, and the risk of repetitive strain injury (RSI) by eliminating time-consuming repetitive tasks. Critically, automation can improve data quality, accuracy and integrity by eliminating the effect of operator-to-operator variability and handling errors.
For many organisations, the number of samples lost due to simple but impactful handling errors is significant and results in, at best, repeat analyses and, at worst, a costly, time-consuming investigation. For example, automated shake-and-fire systems ensure highly repeatable device actuation in metered dose inhaler (MDI) testing by applying a consistent, well-defined device use regime (between actuations), shaking protocol and actuation force profile. This can help to significantly reduce variability in the delivered dose and, by extension, the whole measurement.2 More generally, for all OIPs it is the process of drug recovery that is most amenable to automation, with off-the-shelf solutions ranging from simple rinsing devices through to sophisticated systems for complete automation.
FOCUSING ON DRUG RECOVERY
Developing a robust, optimised method for drug recovery involves the careful consideration of issues such as:
- Which solvent is most appropriate – while highly volatile solvents may be essential to achieve complete dissolution, solvent evaporation can compromise pipetting and the delivery of accurate solvent volumes. Furthermore, volatility enhances the risk of sample concentration due to solvent loss during storage or the drug recovery process.
- How much solvent should be used – high solvent volumes ease complete drug dissolution by improving sink conditions, but simultaneously reduce drug concentration, potentially compromising the accuracy of the assay. Wide variation in the amount of drug that deposits on any given stage of the impactor can make it difficult to ensure complete dissolution of the drug at high loadings while simultaneously ensuring that the sample has a concentration above the limit of detection (LOD)/limit of quantification (LOQ) for stages on which drug deposition is minimal. This issue can be especially challenging for products with more than one active ingredient. There is also a positive environmental impact in lowering solvent content for extraction purposes.
- The best method to promote rapid and effective drug dissolution – to ensure complete dissolution, the drug and solvent must be in contact for an adequate length of time. Agitation accelerates dissolution and helps to ensure complete surface wetting; the application of ultrasonics is an option for less easily dissolved actives.
- What equipment to use to minimise sample degradation – any container in which recovered drug solutions are going to be held, including vials used for analysis, requires careful consideration to avoid, for example, sample loss to vial walls, absorption of the active from the solution and/or solvent evaporation.
A validated drug recovery method may be entirely manual but, where this is the case, analysis will necessarily involve a number of repetitive activities that are either significantly prone to error or physically arduous, or indeed both. Prime examples include pipetting and agitation of a specific test component with a defined aliquot of solvent. With these tasks, even simple devices, such as automated pipettes or rocking/rinsing devices, can make a major difference. For example, the Sample Preparation Unit Model SPU 2000 automates internal rinsing of the USP/PhEur induction port and the Next Generation Impactor (NGI) pre-separator, delivering consistent wetting of the internal surfaces and reproducible dissolution via the application of a defined agitation pattern for a set period of time.
Semi-automation with simple devices of this type is typically low cost and low risk, and the economic payback can be attractive, with analysts freed for higher value activities. On the other hand, more sophisticated off-the-shelf solutions, such as the NGI Assistant, can prove an even more beneficial investment over the long term. Systems which automate multiple steps of the drug recovery process may be associated with higher capital expenditure but can deliver more substantial gains by simultaneously addressing multiple sources of measurement variability. The NGI Assistant automates drug recovery from the point of solvent dispensation and drug dissolution through to the presentation of sample solutions in industry-standard vials, ready for liquid chromatography (LC) analysis, thereby eliminating any requirement for manual pipetting, agitation or LC sample preparation.
In the following study, predominantly manual analysis was compared with more fully automated analysis using this system to demonstrate a) the time savings are accessible and b) whether the data generated are strictly equivalent.
CASE STUDY: COMPARING MANUAL AND SEMI-AUTOMATED DRUG RECOVERY FOR CASCADE IMPACTOR TESTING OF A DPI
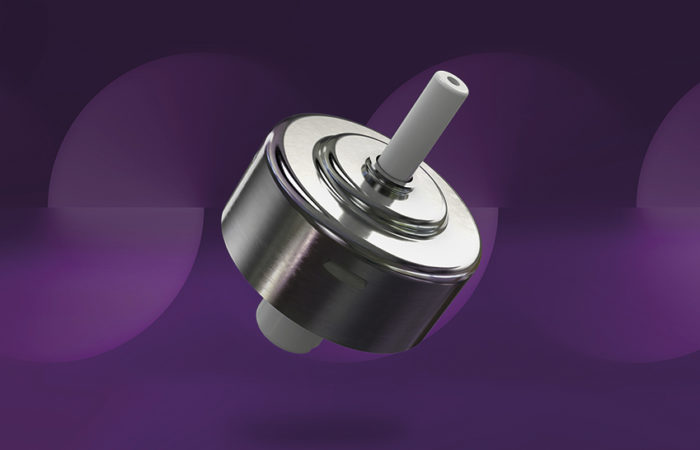
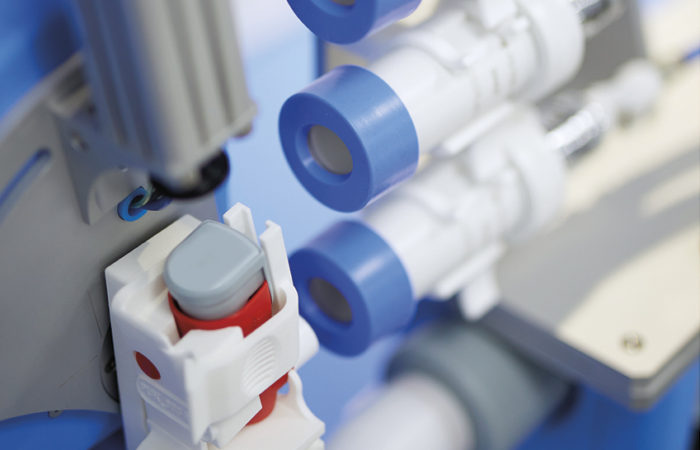
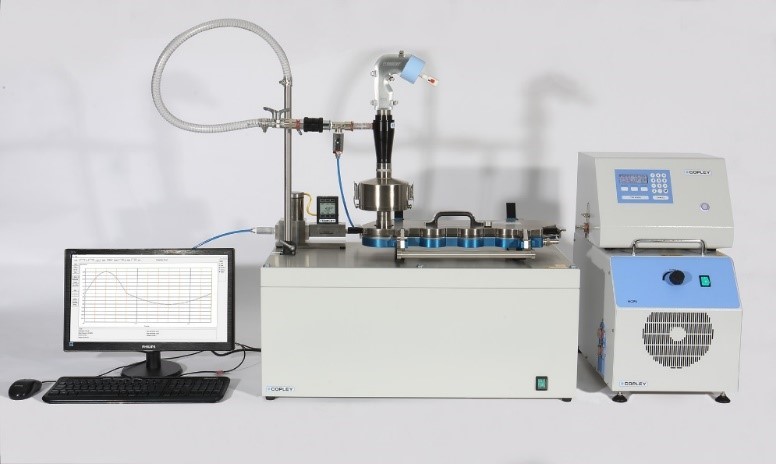
APSD data for a TwinCaps® single-use dry powder inhaler (DPI) were generated using two different methods for drug recovery (Figure 1): an essentially manual recovery method aided by an automated solution for agitation of the solvent in the NGI collection cup tray (NGI Gentle Rocker) and a fully automated recovery with an NGI Assistant. Testing was carried out using an in-house method developed in accordance with the relevant general chapter of the PhEur.3 An NGI with USP/PhEur induction port and pre-separator was used with a test flow rate of 38 L/min, determined on the basis of a 4 kPa pressure drop across the device. A mixed solvent was used for drug recovery (details not specified) and the resulting solutions were quantified using an HPLC system (MA, US). HPLC was carried out using a silica-based column with a mixed aqueous and organic mobile phase (flow rate 0.8 mL/min) and an injection volume of 100 μL.

Figure 1: Copley Scientific equipment was used in many of the manual and automated drug recovery workflows in the study.
HPLC data were analysed using Empower 3 software (MA, US). CITDAS software (Version 3.10) was then used to generate APSD metrics for the inhaler including fine particle dose (FPD), mass median aerodynamic diameter (MMAD) and geometric standard deviation (GSD). A total of 23 replicate tests were carried out in total, 10 by Analyst One using the manual drug recovery method, three by Analyst Two using the same method, and 10 using the more automated method. Mass balances checking (referencing a label claim of 135 μg) confirmed that all runs fulfilled the relevant mass balance criteria: emitted dose (ED) lying between 75% and 125% of label claim.3 Equivalency between the datasets was assessed via t-testing, a statistical method for determining the extent to which two datasets are identical.
“The semi-automation of cascade impaction has an important role to play in improving the quality of OIP test data, while at the same time reducing the cost and effort associated with routine, critical measurements.”
Table 1 shows the percentage variance in the amount of drug recovered from each stage of the impactor for the runs carried out by Analyst One alone and for the two analysts combined. These data illustrate how, in general, variability increases when measurements are carried out by multiple analysts. This intuitive finding stems from the fact that manual analyses are inherently subject to both intra- and inter-operator variability; where more than two operators are responsible for analysis, variance might reasonably be expected to be even higher. Furthermore, the impact of operator variability is likely to be higher with a completely manual method, in the absence of the automated solution for solvent agitation. Since it would be rare for analysis for a given product always to be carried out by a single analyst, the combined Analyst One and Two dataset was selected as the more realistic basis for comparison of the impact of switching to automated drug recovery.
| Analyst 1 |
Analyst 1 and 2 |
|
| Stage 1 | 0% | 10% |
| Stage 2 | 3% | 14% |
| Stage 3 | 6% | 7% |
| Stage 4 | 4% | 3% |
| Stage 5 | 1% | 2% |
| Stage 6 | 2% | 2% |
| Stage 7 | 2% | 2% |
| MOC | 1% | 2% |
Table 1: Percentage variability in the mass (μg) recovered from each stage of the impactor by Analyst 1, and by Analyst 1 and 2 combined.
Table 2 shows t-test data (two-sample, unequal variances) for a comparison of the results produced by the established, more manual method (Analyst One and Two) and via automated drug recovery. When automating a manual method, it is crucial to confirm that the results are equivalent using statistical methods such as these. In the absence of such cross-validation, systematic differences can be introduced that ultimately result in the product failing to meet specification. Here, analysis shows that, for every stage, the absolute value of the t-statistic lies below t-critical and the associated p-value is well above the threshold value of 0.05, confirming statistical equivalence. Robust equivalence is also observed in the APSD parameters generated by each method (Table 3).
| p-value | t-Stat | t-Critical | |
| Stage 1 | 0.28 | -1.12 | 2.10 |
| Stage 2 | 0.38 | -0.89 | 2.08 |
| Stage 3 | 0.61 | -0.51 | 2.08 |
| Stage 4 | 0.36 | 0.94 | 2.11 |
| Stage 5 | 0.33 | 1.00 | 2.12 |
| Stage 6 | 0.28 | 1.12 | 2.14 |
| Stage 6 | 0.73 | -0.35 | 2.10 |
| MOC | 0.19 | -1.36 | 2.12 |
Table 2: Comparing the equivalence of manual and automated drug recovery.
Monitoring analyst bench time during the study enabled calculation of the productivity gains accessible by switching to the more automated method. The results indicate that analyst bench time is reduced by around 40%, a substantial increase in productivity. The study also provides a good illustration of the potential to progressively adopt automation solutions, with cross-validation at each stage reducing the risk of introducing systematic differences.
| p-value | t-Stat | t-Critical | |
| FPD | 0.46 | 0.76 | 2.10 |
| MMAD | 0.39 | -0.88 | 2.09 |
| GSD | 0.21 | -1.31 | 2.09 |
Table 3: Critical metrics generated using manual and automated drug recovery methods were shown to be statistically equivalent.
CONCLUSION
The semi-automation of cascade impaction has an important role to play in improving the quality of OIP test data, while at the same time reducing the cost and effort associated with routine, critical measurements. This study illustrates how sophisticated, easy-to-use, off-the-shelf solutions can be used to generate statistically equivalent data and deliver major productivity gains, reducing analyst bench time by around 40%. By freeing analyst time for more valuable, less repetitive tasks, such solutions can help to minimise the risk of out-of-specification results, address health and safety concerns, and, at the same time, deliver an attractive return on investment.
REFERENCES
- Bonam M et al, “Minimizing Variability of Cascade Impaction Measurements in Inhalers and Nebulizers”. AAPS Pharm Sci Tech, 2008, Vol 9(2), pp404–413.
- Copley M et al, “Optimizing the role of automation in variability reduction strategies for delivered dose uniformity (DDU) and aerodynamic particle size distribution (APSD) testing of inhaled drug products”. Inhalation, Dec 2019.
- “Aerodynamic Assessment of Fine Particles”. European Pharmacopoeia, Chapter 2.9.18.