
To Issue 167
Citation: Brooks C, “Cascade Impactor Metrics: Exploring New Guidance on Data Analysis”. ONdrugDelivery, Issue 167 (Nov 2024), pp 54–58.
Clair Brooks examines the parameters used to quantify and compare the aerodynamic particle size distribution metrics of orally inhaled drug products and methods for calculation, including those laid out in the new USP <1604>, with reference to both “standard” and efficient data analysis metrics to elucidate current debate and establish sufficient understanding for the effective day-to-day application of these methods.
Although the aerodynamic particle size distribution (APSD) metrics measured by cascade impaction are critical quality attributes for all orally inhaled drug products (OIPs), the data analysis methods used to produce them typically attract little attention. Except when, as is the case right now, change is in the air. The release of a new US Pharmacopeia (USP) general chapter on the presentation of APSD data – USP <1604> – has implications for how these vital metrics are calculated and is triggering debate within the inhalation community.
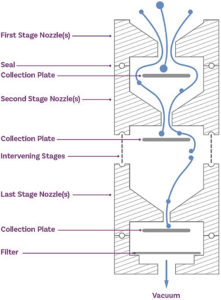
Figure 1: Cascade impaction size fractionates an incoming dose on the basis of particle inertia, producing a series of samples that are subject to assay to determine APSD metrics for the API.
FROM MEASUREMENTS TO METRICS: MANIPULATING FULL RESOLUTION CASCADE IMPACTOR DATA
Multi-stage cascade impactors size fractionate an incoming OIP dose on the basis of particle inertia (Figure 1). Subsequent drug recovery from each part of the impactor set-up – OIP mouthpiece, induction port and adapter, pre-separator (if present), each stage of the impactor and the micro-orifice collector or filter (Figure 2) – produces a series of solutions that are then subject to assay, typically by high-performance liquid chromatography. The resulting raw data quantify distribution of the API through the cascade impactor set-up at a defined test flow rate and are the starting point for cascade impactor data analysis.
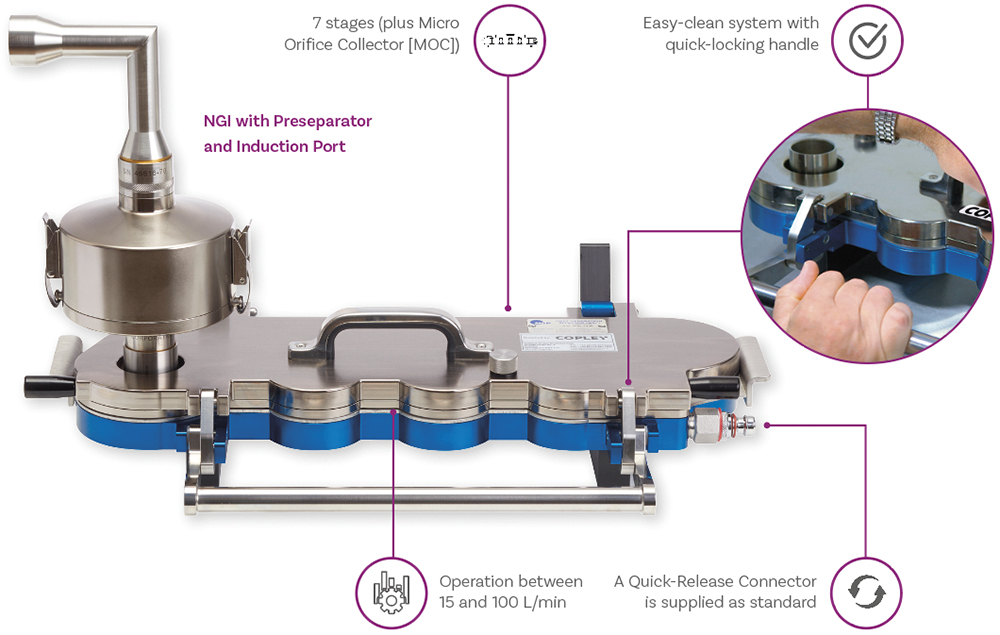
Figure 2: Drug recovery from each component of the cascade impactor test set-up – such as the NGI compendial set-up for dry powder inhalers shown here – enables robust assessment of the dose released from an OIP.
A first step is to confirm the validity of the measurement by carrying out a mass balance test. This involves comparing the total mass of drug recovered from all components on a per actuation basis, with the expectation in USP <601> being that collected mass should lie within 85–115% of the label claim.
The next step is to process the data to meet its optimal intended purpose, which, in basic terms, is relevant comparison with a target or specification. In R&D, APSD measurements support progress towards the consistent delivery of particles that are optimally sized for deposition in specific areas of the respiratory system, with 5 μm taken as the upper limit for deposition in the lung. At this stage, comparison is therefore typically to answer questions such as “Does device A successfully aerosolise more of the dose than device B?” or “Does the inclusion of more co-solvent enhance dispersion?” In quality control (QC) on the other hand, the comparison is with an established product specification to reliably confirm parity.
Both applications are best served by metrics that combine sensitivity and relevance. One approach to data analysis would be to simply overlay measured and reference APSDs. This can be a helpful exercise, as it certainly identifies differences, but not in a way that is necessarily easy to interpret with respect to likely drug delivery performance or that facilitates straightforward comparison and reporting. Alternatively, the single number metrics that have been established quantify relative performance, rather than simply detecting difference, and therefore boost the informational output of analysis.
Mass Median Aerodynamic Diameter and Geometric Standard Deviation
Mass median aerodynamic diameter (MMAD) – the aerodynamic diameter below which 50% of the population lies – by mass, is one of the most widely reported APSD metrics. It identifies the centre point of the APSD and, for products that exhibit a log-normal distribution, is often reported along with the geometric standard deviation (GSD), a complementary metric that indicates spread or breadth. Targeting an MMAD in the region of 2–3 μm in combination with a low GSD is a widely deployed strategy for maximising delivery to the lung with coarser particles, and to a lesser extent fines, both less well suited to efficient drug delivery.
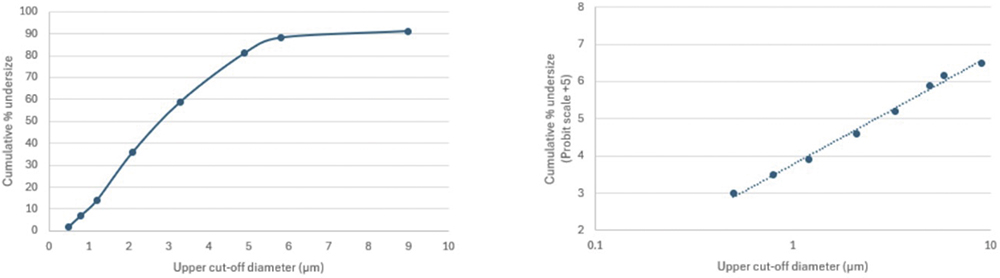
Figure 3: The non-linear spacing of the cut-off diameters of cascade impactor stages can make it beneficial to convert a linear plot of cumulative mass (left) to a log-probit plot (right) to derive metrics of interest.
Determining a value for MMAD involves, in the first instance, producing a curve of cumulative sized mass, sequentially summing the masses collected on each stage of the impactor and plotting the results against a stage cut-off diameter (Figure 3). Using a linear axis for the cut-off diameter (Figure 3 – left) highlights the non-linear spacing of stage cut-off diameters in a multi-stage cascade impactor.
Both the Andersen cascade impactor (ACI) and next-generation impactor (NGI) beneficially have a concentration of stages – typically at least five – in the size range of interest for inhaled drug delivery (Figure 4) to boost resolution in this critical area. However, this can make a linear plot sub-optimal for accurate interpolation. The logarithmic x-axis of the log-probit plot (Figure 3 – right) addresses this issue, resulting in a linear graph with more equal data point spacing. Using the probit scale for the y-axis is a further potential simplification, with Probit 4 equating to a cumulative percentage of 15.8%, Probit 5 to 50% and Probit 6 to 84.1% (from standard statistical manipulations).
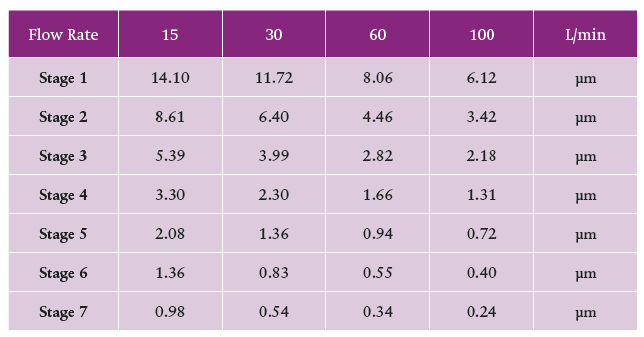
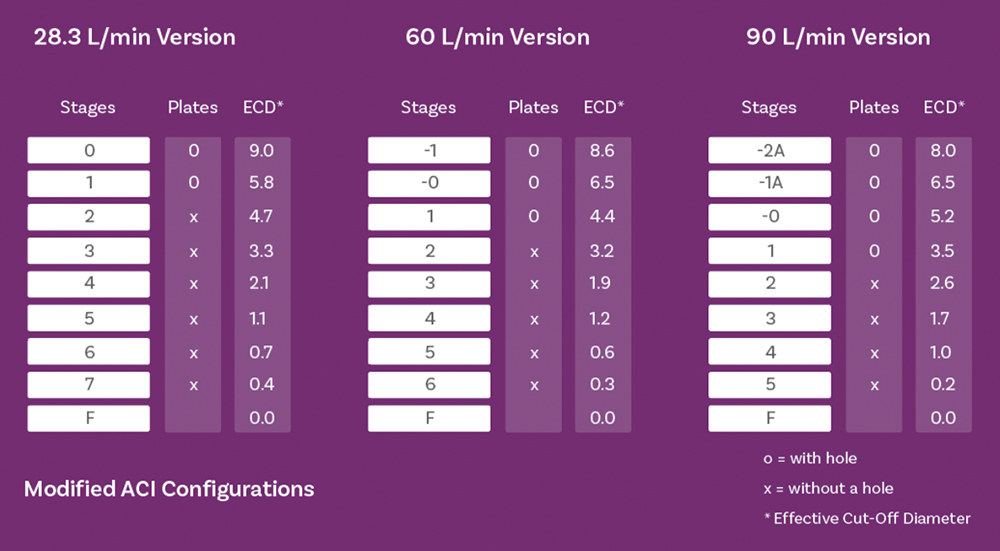
Figure 4: Stage cut-off diameters for the NGI (top) and ACI (bottom) show a concentration of stages with values in the <5 μm fraction of interest, across all relevant test flow rates.
Methods for determining MMAD from either plot include performing a linear regression over the whole data set, sigmoid curve fitting using a model such as Mercer-Morgan-Flodin or Chapman- Richards, or simple linear interpolation. A full exploration of the relative merits of these methods lies beyond the scope of this article, but published studies highlight some valuable conclusions relating to method choice:1,2
- The application of linear regression across the whole data set is underpinned by an assumption of a log-normal distribution in the mass-weighted raw data that does not hold for many OIPs; predicting those it does hold for is challenging.
- Linear regression gives equal weighting to each collected mass, which may be far from ideal given the relatively small masses associated with stages at the extremes of the APSD.
- An incorrect assumption of log-normality produces substantially different answers from the listed curve-fitting and linear interpolation methods.
- Curve-fitting and linear interpolation methods show close agreement for all formulations, whether they exhibit a log-normal distribution or not.
- These conclusions help to justify the widespread use of interpolation, which has the additional advantage of being mathematically straightforward.
Fine Particle Dose and Fine Particle Fraction
An important limitation of MMAD, even in combination with GSD, is that it does not quantify the fraction of the dose that lies in the size range of interest or the success of dose dispersion to a respirable size relative to the delivered dose. Products with a closely similar MMAD and GSD could therefore exhibit clinically significant differences with respect to dose delivery to the lung. Cascade impactor data capture two independent characteristics of the delivered dose: size and mass. Differentiating samples with respect to either characteristic calls for metrics that reliably quantify each or both.
“By quantifying mass, these metrics bring complementary orthogonality to MMAD enabling more robust sample differentiation.”
Therefore, additional metrics are used, such as fine particle dose (FPD) – the mass of drug in the sub-5 μm fraction of the dose – and its complement, fine particle fraction (FPF), the FPD expressed as a fraction of the delivered dose. By quantifying mass, these metrics bring complementary orthogonality to MMAD enabling more robust sample differentiation. They can also help to distinguish between, for example, issues associated with device emptying as opposed to dispersion to a significantly fine particle size. Both FPD and FPF are used routinely to define acceptance criteria for QC, often complemented by individual mass per stage or additional grouped stage specifications to provide the necessary insights.
EFFICIENT DATA ANALYSIS
Ongoing debate around the most efficient way of applying APSD data has, over the years, led to the introduction of additional metrics, with the aim of ensuring robust assessment within the constraint of minimising the analytical and data-handling burden associated with the routine use of full-resolution cascade impaction.3 This leads the discussion to efficient data analysis (EDA) and the associated abbreviated impactor measurement (AIM) concept.
Figure 5 defines a range of alternative APSD metrics, along with AIM configurations associated with their measurement.4 In R&D, where the primary focus is to maximise the respirable dose, it can be argued that it is simply the mass of drug above and below the 5 μm cut-off that is of defining interest. Therefore, in many instances, it is possible to measure only fine particle mass (FPM) – which is equivalent to FPD – and coarse particle mass (CPM). An additional fraction, the extra fine particle mass (EPM), which is the <1 μm dose, may also be of interest, given the potential risk of exhalation. An AIM apparatus with one or two stages and a 5 and 1 μm stage cut-off, is sufficient to deliver these metrics, the alternative being to appropriately group full-resolution data.
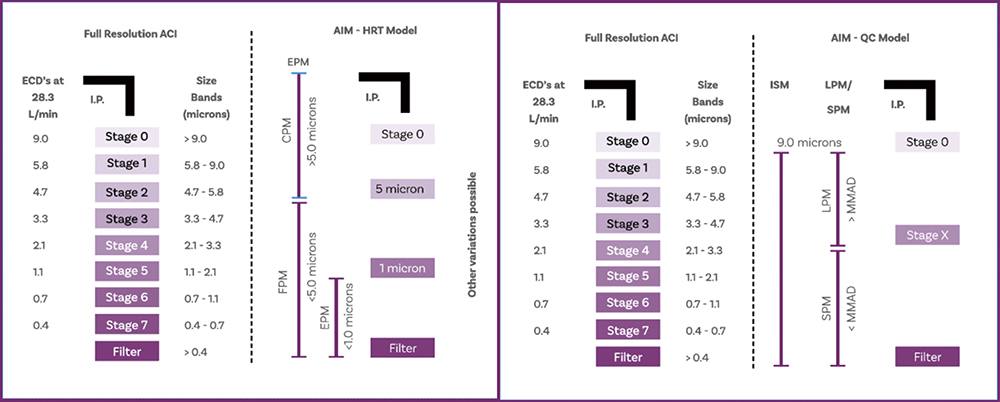
Figure 5: The goal of EDA is to minimise the number of metrics calculated within the constraint of robust and relevant sample differentiation in R&D (left) and QC (right); AIM minimises the analytical burden associated with producing these metrics.
Turning to QC, here the aim is to capture difference in the APSD, in mass and/or size, with high sensitivity. Research has shown that an effective way to do this is by measuring small particle mass (SPM) and large particle mass (LPM), with the cut-off between the two fractions set to within 0.3 and 3 times the MMAD.5 The ratio of SPM to LPM has proven extremely sensitive to changes in MMAD, while summing SPM and LPM produces the impactor-sized mass (ISM), a complementary indicator of changes in respirable mass. Again, ISM, SPM and LPM can either be determined using AIM apparatus, with a single stage with an optimally specified cut-off diameter, or from full-resolution cascade impactor measurements.
A key point to notice about these two sets of parameters is that they differ with respect to the total mass considered, which is an important distinction. Summing FPM and CPM gives the total emitted mass exiting the OIP. In contrast, ISM is just what it says: the mass sized by the impactor alone, excluding deposits in the non-sizing components of the set-up. With the ACI, and in the absence of an NGI’s pre-separator, this includes the first stage of the impactor, since it has no upper size limit and is therefore essentially non-sizing. The NGI pre-separator has calibrated performance and therefore imposes an upper size limit on the first stage of the NGI, when in use (Figure 6).
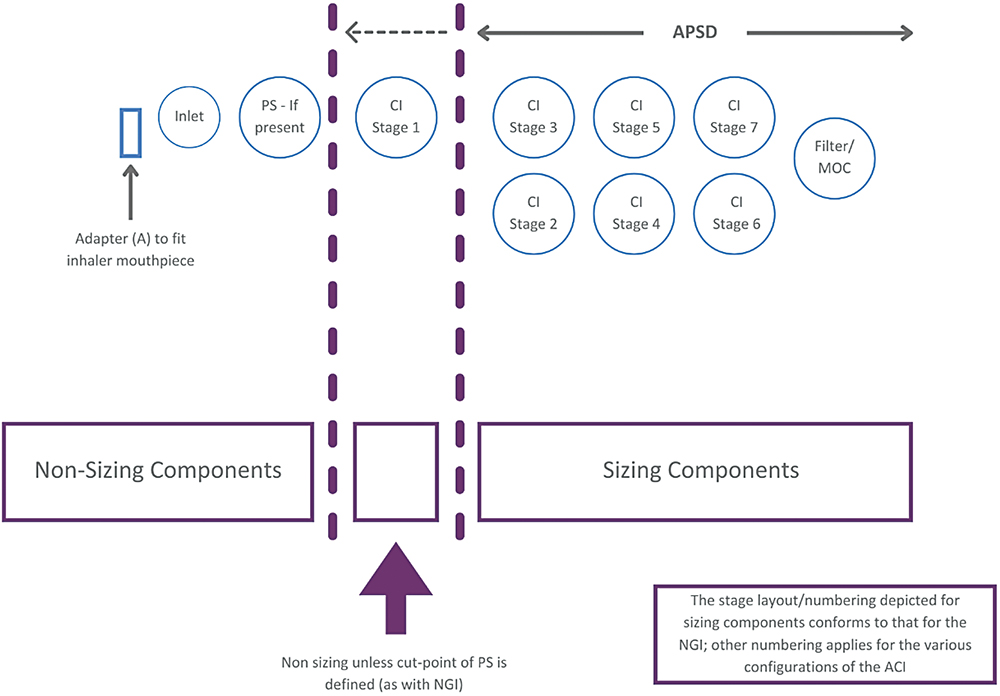
Figure 6: Within a cascade impactor test set-up there are both non-sizing and sizing components; an appreciable portion of the emitted dose though captured is not sized.
The instruction in USP <601> is that “only data from analysis of deposition on the collection plates should be used for the purpose of determination of stage deposition”. For historical reasons and in the absence of further detail in more recent versions of USP <601>, this has led, in some instances, to the inclusion of deposition data from the first stage, whether a pre-separator is present or not. In other words, MMAD is not consistently calculated on the basis of ISM. This is an important point to bear in mind with discussions of USP <1604>.
REVISED COMPENDIAL METHODS: PRACTICE AND IMPLICATION
USP <1604> became official in December 2023 following extensive consultation and revision. It presents two approaches for cascade impactor data evaluation and two “optional uses for APSD data, which are developmental in nature”. Under the first heading lie methods for the representation of the deposition profile (DP) for the entire delivered mass and assessment of the DP via stage groupings. The optional methods focus on the portion of that data associated with sizing components, including MMAD; in this regard the new guidance is aligned with USP <601>.
Methods for the presentation of a DP and for comparing stage groupings use data from both sizing and non-sizing components, making them consistent with the approaches for establishing CPM, FPM and EPM discussed earlier. However, it is also possible to interpret the guidance as indicating that the “cumulative deposition profile” (CDP), which incorporates data from sizing components alone, should be used for all APSD metrics – CDP, FPD and EPD, as well as MMAD. The observation that, when calculating sized fractions, “the normalising factor can either be labelled delivered dose (or target delivered dose) by the cascade impactor or ISM, depending on purpose” underlines this ambiguity; the introduction and use of the term “sized distribution profile” has also proven a further complicating factor.
For the determination of the CDP, and by extension the MMAD, USP <1604> clearly classifies the first stage of the impactor as a non-sizing component, except for the NGI in the presence of a pre-separator. This new guidance has therefore caused some to question the methods established with reference to USP <601> that, by including deposition data from the first stage, return different values of MMAD. Expert industry groups, such as the International Pharmaceutical Aerosol Consortium on Regulation and Science (IPAC-RS), have recognised this issue, which feeds into their ongoing work to raise awareness of the metrics used to characterise OIPs and the associated calculation methods.3,4 A group within IPAC-RS is now focusing specifically on the implications of USP <1604> and how best to help researchers navigate the new guidance.
“A lack of clarity in certain areas could overshadow these valuable additions to the information available to inform cascade impactor data analysis.”
USP <1604> goes on to include useful detail on how to determine CDPs based on the ISM for different cascade impactor configurations operating at specific flow rates. It also offers helpful elucidation on alternatives to the USP growth curve method (linear regression over the whole data set) for the many OIPs that do not exhibit a log-normal distribution. However, a lack of clarity in certain areas could overshadow these valuable additions to the information available to inform cascade impactor data analysis. USP <1604> is therefore currently stimulating debate around cascade impactor data analysis rather than bringing it to consensus.
REFERENCES
- Christopher JD et al, “Generalized simplified approaches for mass median aerodynamic determination”. Pharm Forum, 2010, Vol 36(3), pp 812–823.
- Mitchell JP et al, “Proposals for data interpretation in the context of determination of aerodynamic particle size distribution profile for orally inhaled products”. Pharm Forum, 2017, Vol 43(3), pp 637–645.
- Doub WH et al, “Efficient data analysis (EDA): Size, mass and common sense” Inhalation, Aug 2021.
- Mitchell JP, Nagel MW, Copley M, “The abbreviated impactor measurement concept”. Inhalation, Jun 2009.
- Tougas TP et al, “Improved quality control metrics for cascade impaction measurements of orally inhaled drug products (OIPs)”. AAPS PharmSciTech, 2009, Vol 10(4), pp 1276–1285.
Previous article
REFORMULATING pMDIS WITH NEXT-GENERATION SUSTAINABLE PROPELLANTSNext article
Pharmapack 2025 Insights Overview